
A mathematician or a statistician would probably trust the Central Limit Theorum. In addition to predicting a Normal distribution, the CLT predicts that the standard deviation of many samples will decrease when taken from the same parent population. Analytical Chemists know this as the multi-channel effect which, for example, makes an FT-IR much less noisy than a scanning IR spectrometer.
Financial folks seem to periodically wonder if the math is true. Below is data from another Risk v. Return study by USA Today showing that if you average the return over more periods, your return coalesces on a more predictable value (mean), with less volatility (standard deviation). BTW, the Central Limit Theorum works for gas mileage of your car, too.
| Holding Period | Max Return | Avg Return | Min Return |
| 1 yr | +53.4% | +8.4% | -44.8% |
| 3 yr | +30.1% | +7.4% | -17.3% |
| 5 yr | +26.2% | +7.5% | -8.5% |
| 10 yr | +16.8% | +7.3% | -5.1% |
| 20 yr | +14.4% | +7.2% | +2.4% |
.
What is interesting to me is that as the holding period increases, the average nearly monotonically approaches the historical value (the 3 yr 7.4 doesn’t fit this trend). In other words, any shorter holding period not only is more volatile, it reliable gives a higher average. It shifts the burden of averaging onto the individual investor rather than the market.
In other words, you can enjoy the higher average return of a volative market if YOU buy lots of random things. If you buy just one thing such as the S&P500 index studied above, then you have to wait until lots of OTHER people buy and sell it over time.
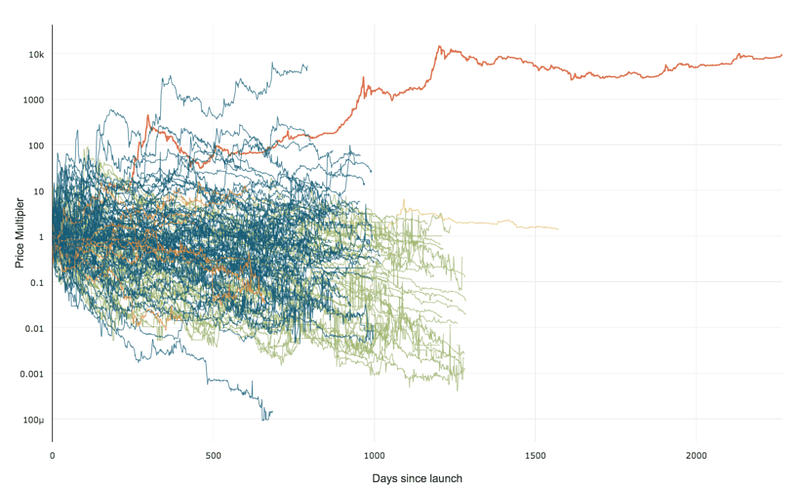 99% of ICOs Will Fail
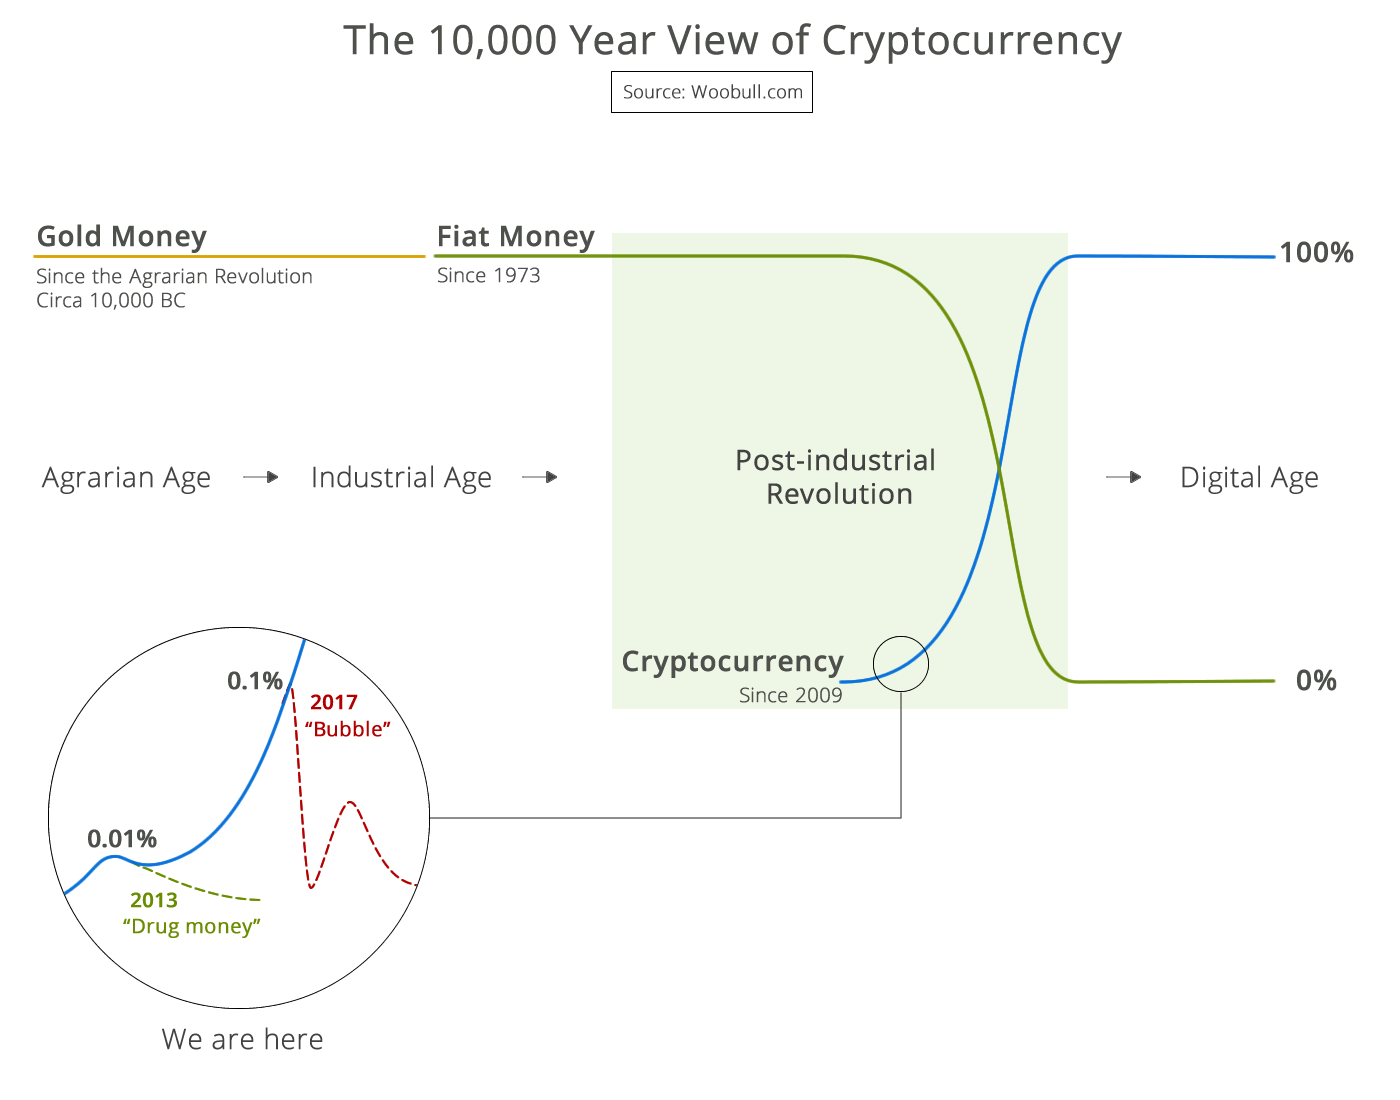 The 10,000 year view of cryptocurrency